| TRIOS Overview |
| TRIOS Button |
| Quick Access Toolbar |
| The Ribbon |
| Document Tabs |
| Experiment View Tabs |
| Panes |
| Status Bar |
TA Instruments' TRIOS software executes instrument experiments, collects and analyzes data, and prepares results reports.
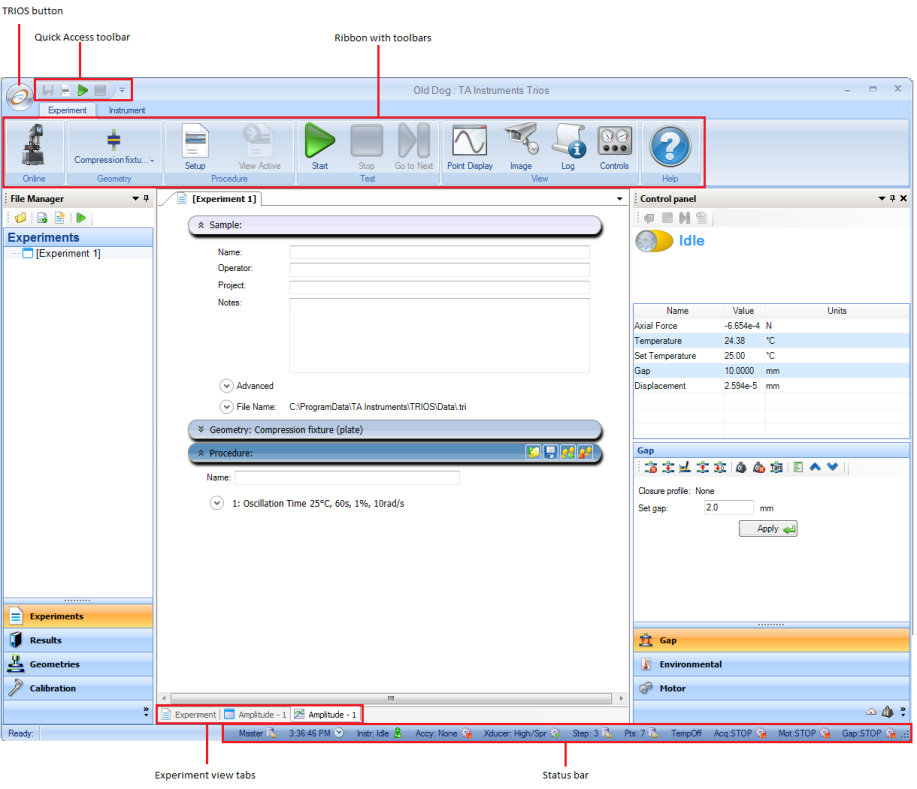
The TRIOS workspace maximizes the main work area while providing access to all the other functions and elements of this system. You can customize these elements in a way that best suits your needs and preferences. See the topics below for a tour of the TRIOS workspace.
The figure below shows the main components of the TRIOS workspace. Many of these components can be configured to appear as you desire.
The following is a list of the main components. Click on the link for further information.
The TRIOS button ![]() replaces the traditional "File" menu, and is located in the upper-left corner of the TRIOS program.
replaces the traditional "File" menu, and is located in the upper-left corner of the TRIOS program.
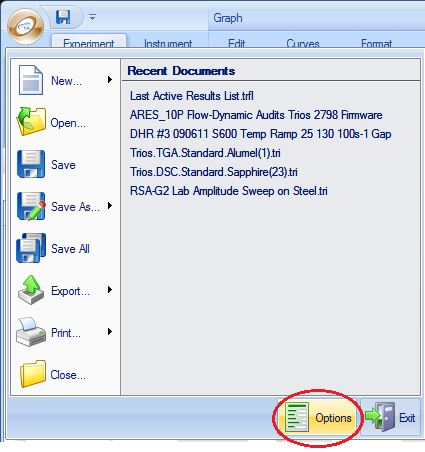
Clicking the TRIOS button enables the drop-down menu, as seen in the figure below. In addition to creating new documents, opening existing documents, and saving, printing, exporting, or closing documents, you can set up various program options using the Options button (circled below). Click Exit to close the application.
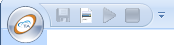
The Quick Access Toolbar (shown below) presents a set of commonly-used functions that are quickly accessible. This toolbar can be moved and customized.
The TRIOS Ribbon (shown below) is organized into a set of tabs (Experiment, Instrument, etc.). Each tab contains a set of toolbars, and each toolbar contains a set of functions. For example, the Experiment tab (shown below) contains the toolbars Online, Geometry, Procedure, Test, View, and Help.
To minimize the Ribbon, right-click within the Ribbon to display the pop-up menu and select Minimize the Ribbon.
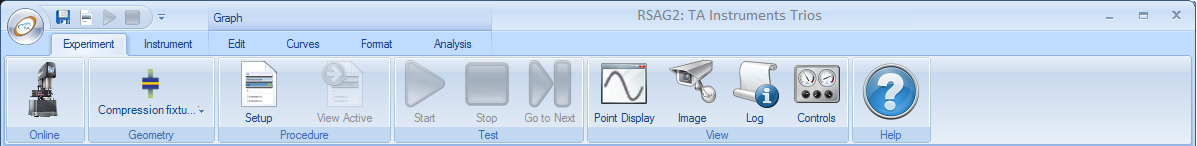
Each tab has its own set of controls, which are arranged into groups ("toolbars") based on their functions. The options vary based upon the displayed view of the data file (that is, graph, spreadsheet, etc.).
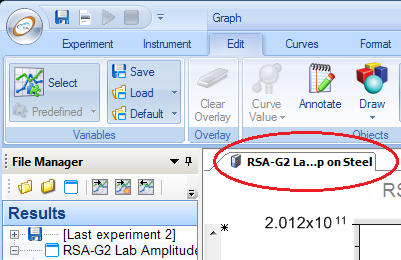
Each open document within TRIOS is represented with a tab (circled below) located at the top of the main panel.
To switch between open documents you can use any of the following methods:
Experiment documents contain one or more view tabs. When a new experiment is selected, only the Experiment tab, which contains experimental conditions, displays in the Experiments pane of the File Manager (Note that for thermal files, the Experiment tab is called the Run tab when working in the Results pane). Once the experiment starts and data collection begins, the results display in spreadsheet ![]() and graph
and graph  tabs in the Results pane. If there are multiple steps within the experiments, the other steps can be shown on separate view tabs. For additional information, see Understanding the Experiment Pane.
Various view panels can be displayed and arranged as desired depending upon the functions you use most often. The layout can then be saved for future use, if desired.
The File Manager panel is a central component of TRIOS software. It manages the display of the experiment sequence and results documents, as well as other components specific to instrument type such as calibration and Geometry Manager. A navigation bar is used to switch between these views in the File Manager. Refer to Understanding the File Manager for additional information.
A Properties panel is available for many components of the TRIOS system. These panels are used to customize the parameters of the selected component. To access the Properties panel, right-click in the plot or spreadsheet and select Properties... from the pop-up menu. Refer to Customizing TRIOS Properties for additional information.
The Notification Manager contains all of the logged messages generated by both controller and all connected instruments. It is a great tool to help troubleshoot issues.
To access it, click Experimenttab > Log ![]() . For additional information, see Using the Notifications Manager.
. For additional information, see Using the Notifications Manager.
The Control panels in TRIOS display real time signals and the current running method, and also provide control of instrument components. To open a Control panel, select Experimenttab > Controls ![]() . For more information, refer to your specific instrument's Control panel Help topics.
. For more information, refer to your specific instrument's Control panel Help topics.
The status bar is located at the bottom of the TRIOS workspace. It displays the status of the selected instrument, the current time, and other pertinent instrument-related information.
